Designed for Humans
Powerful features,
zero complexity
Every feature saves you time instead of wasting it on complex menus and hidden settings.
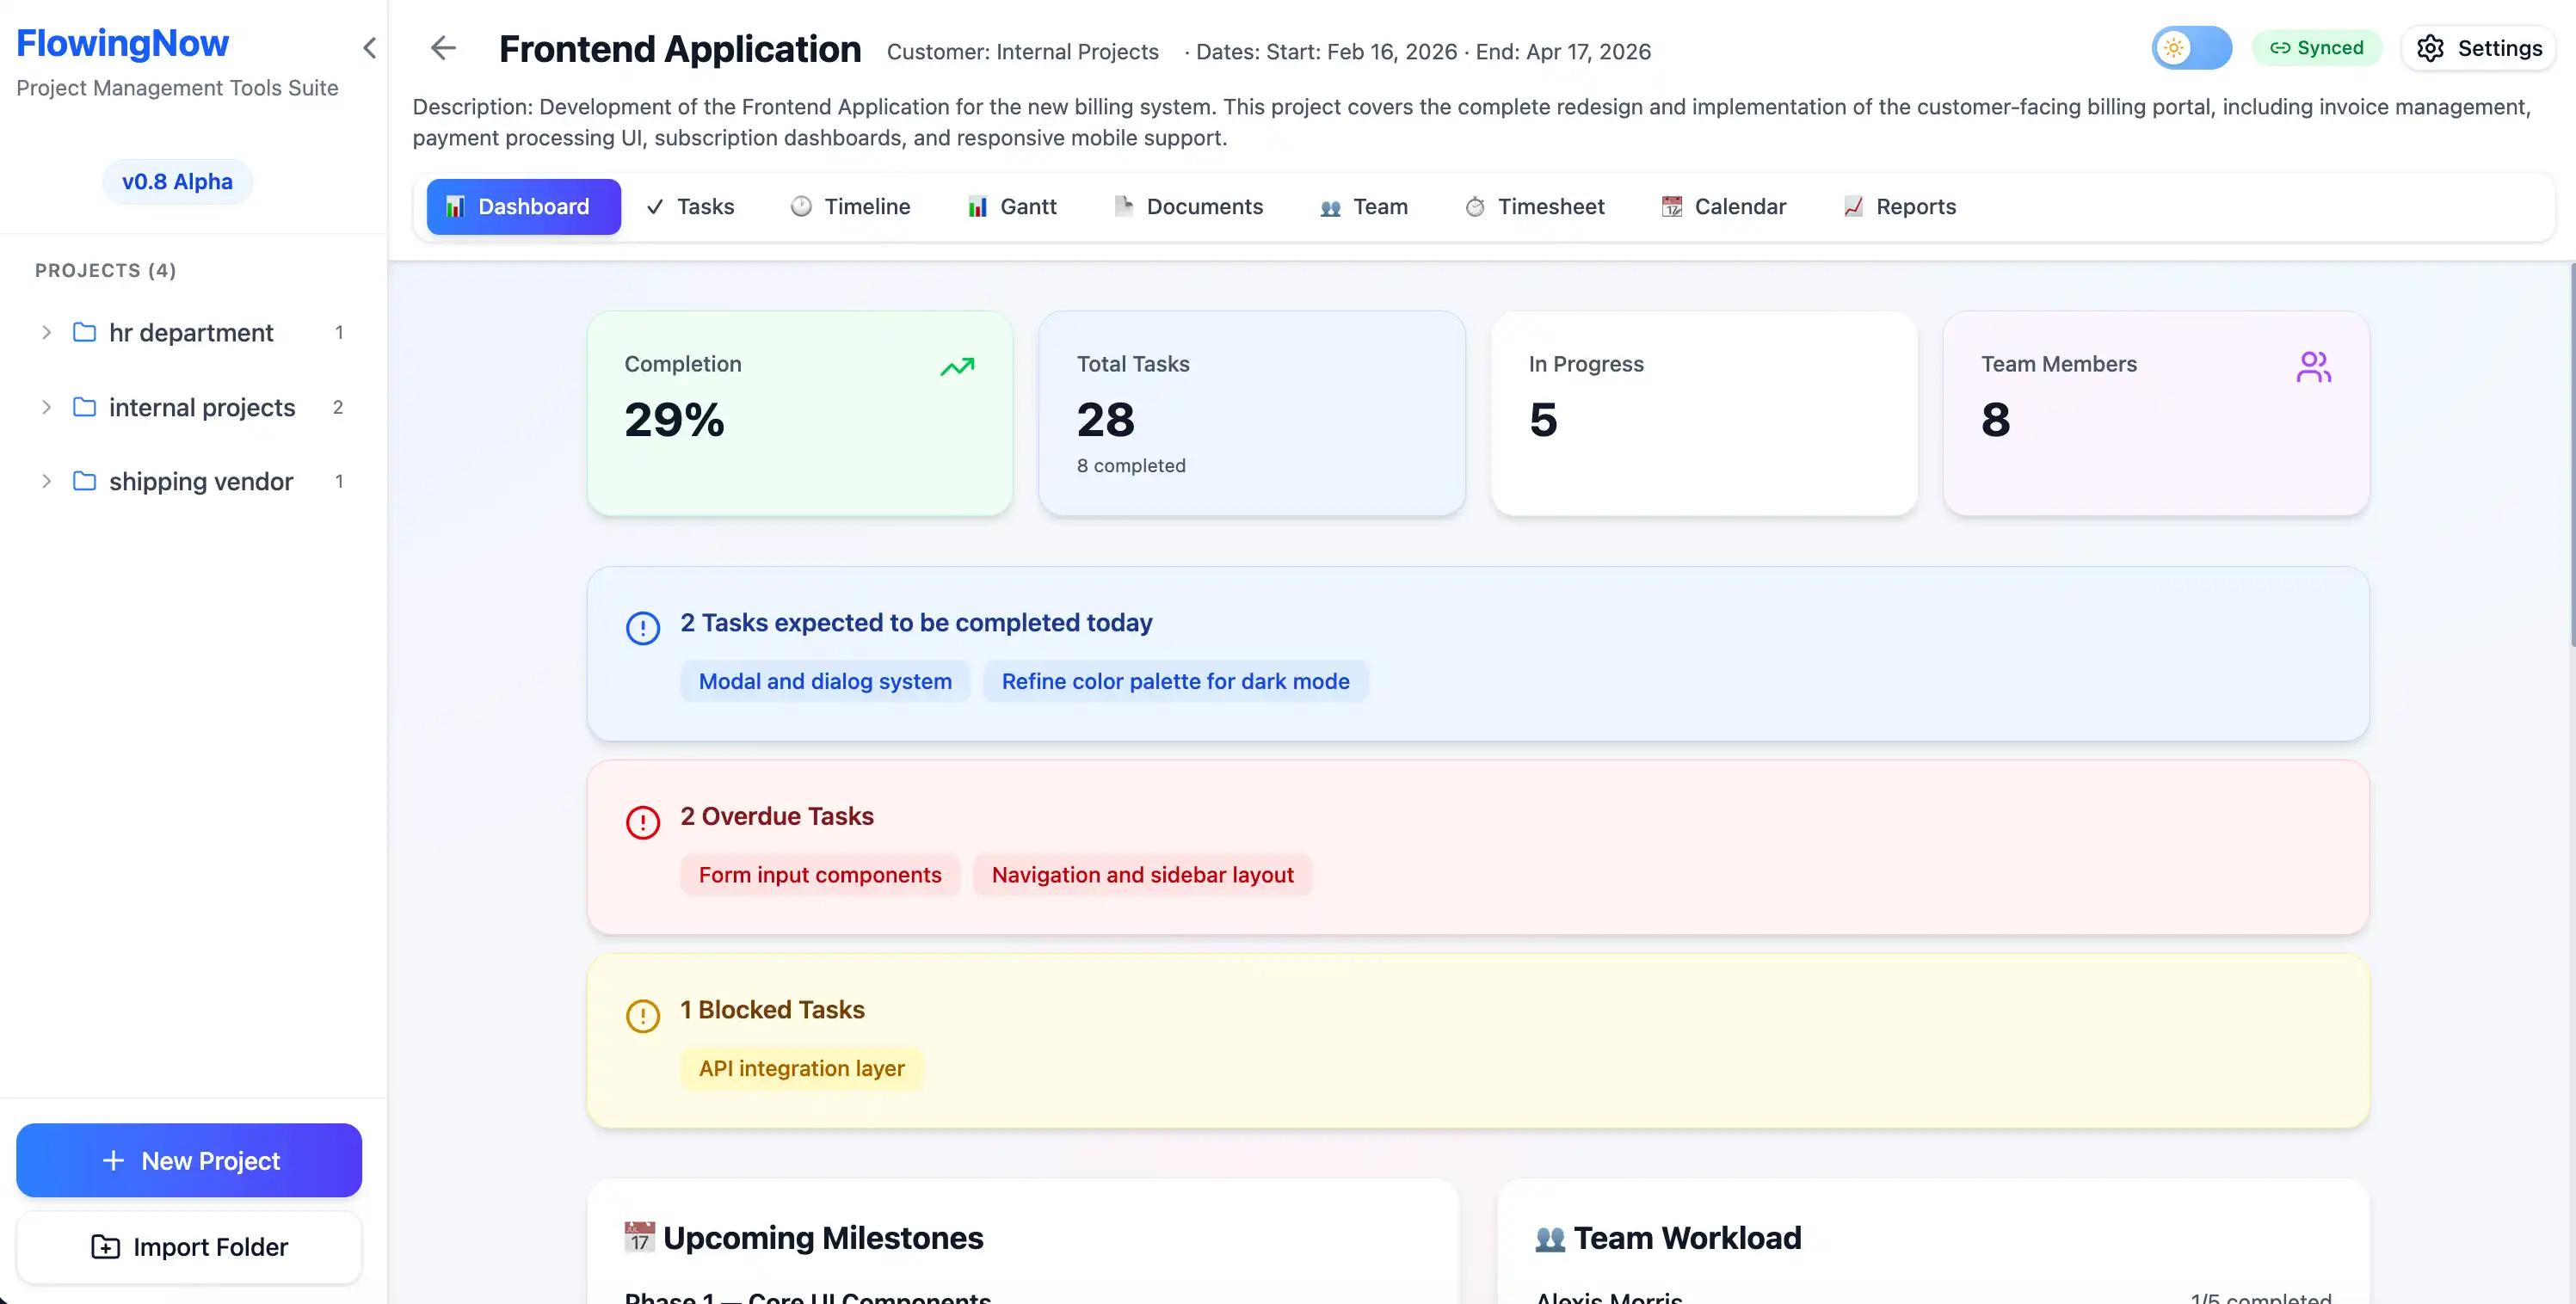
Everything at a Glance
Open your project and instantly know where things stand. The dashboard shows task progress, budget health, team activity, and upcoming milestones, all on a single screen.
- Task status breakdown with clear visual indicators
- Budget and spending overview
- Upcoming milestones and deadlines
- Recent activity and team workload
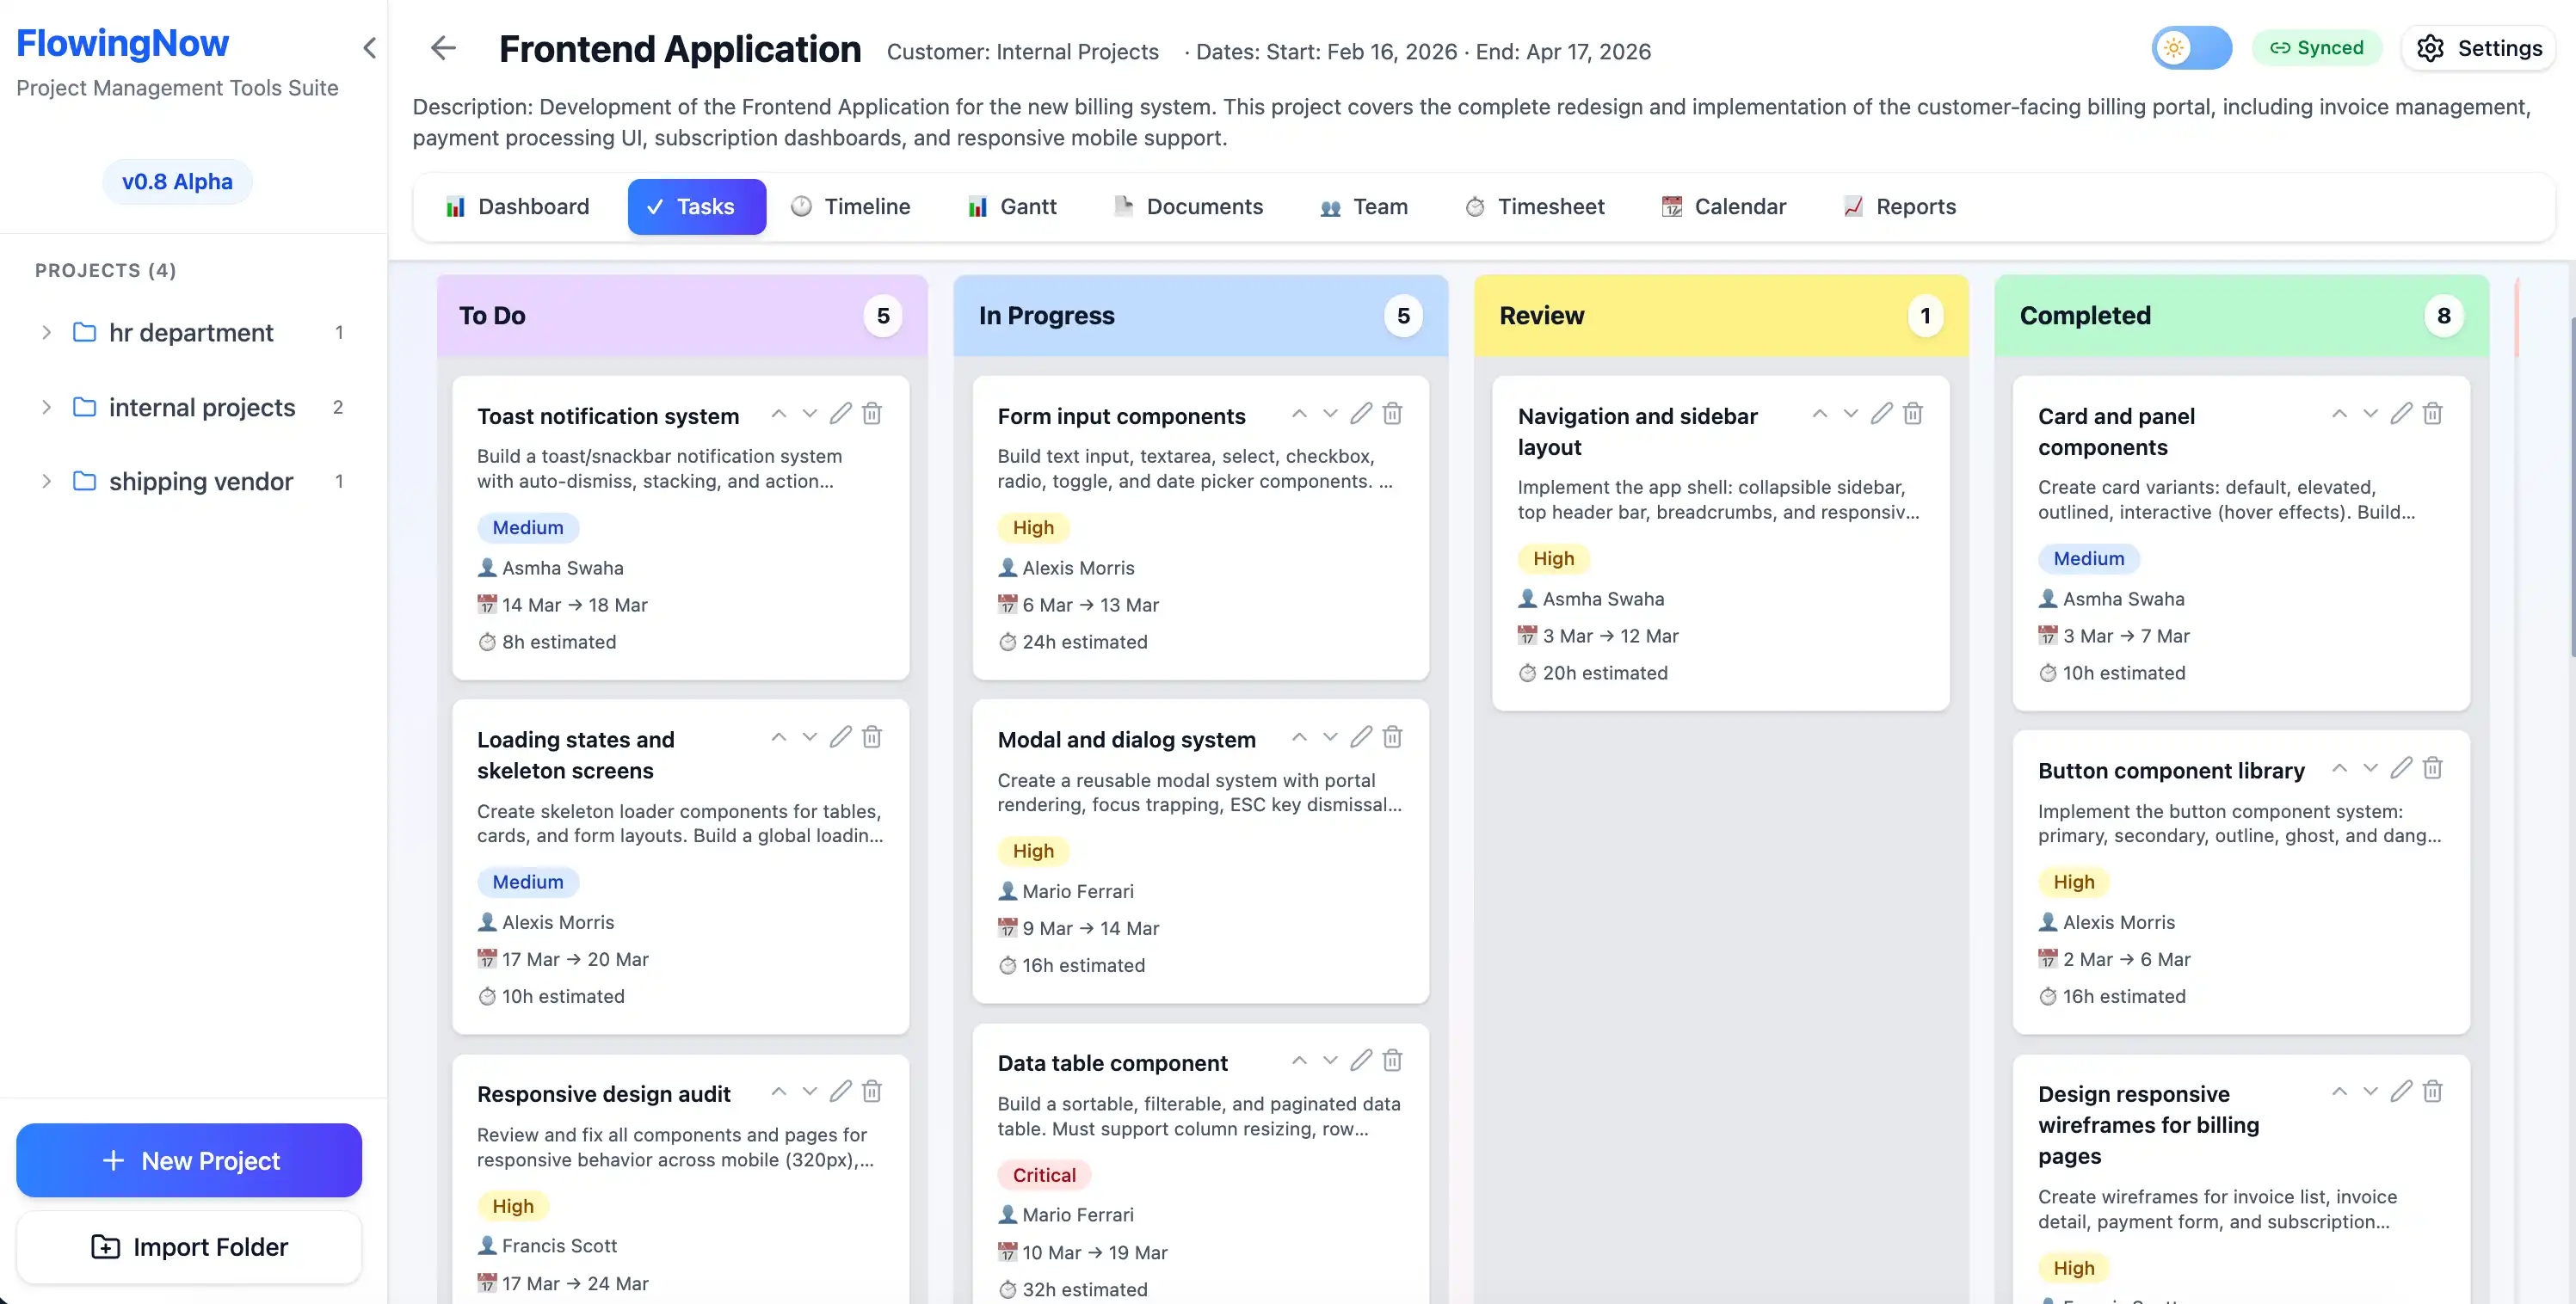
Task Boards
Organize tasks the way your brain works. Move cards between columns, and everyone on the team sees the same picture.
- Six clear columns: Backlog to Completed
- Drag-and-drop cards between columns
- Colored badges for priority and assignee
- Click any card for full details
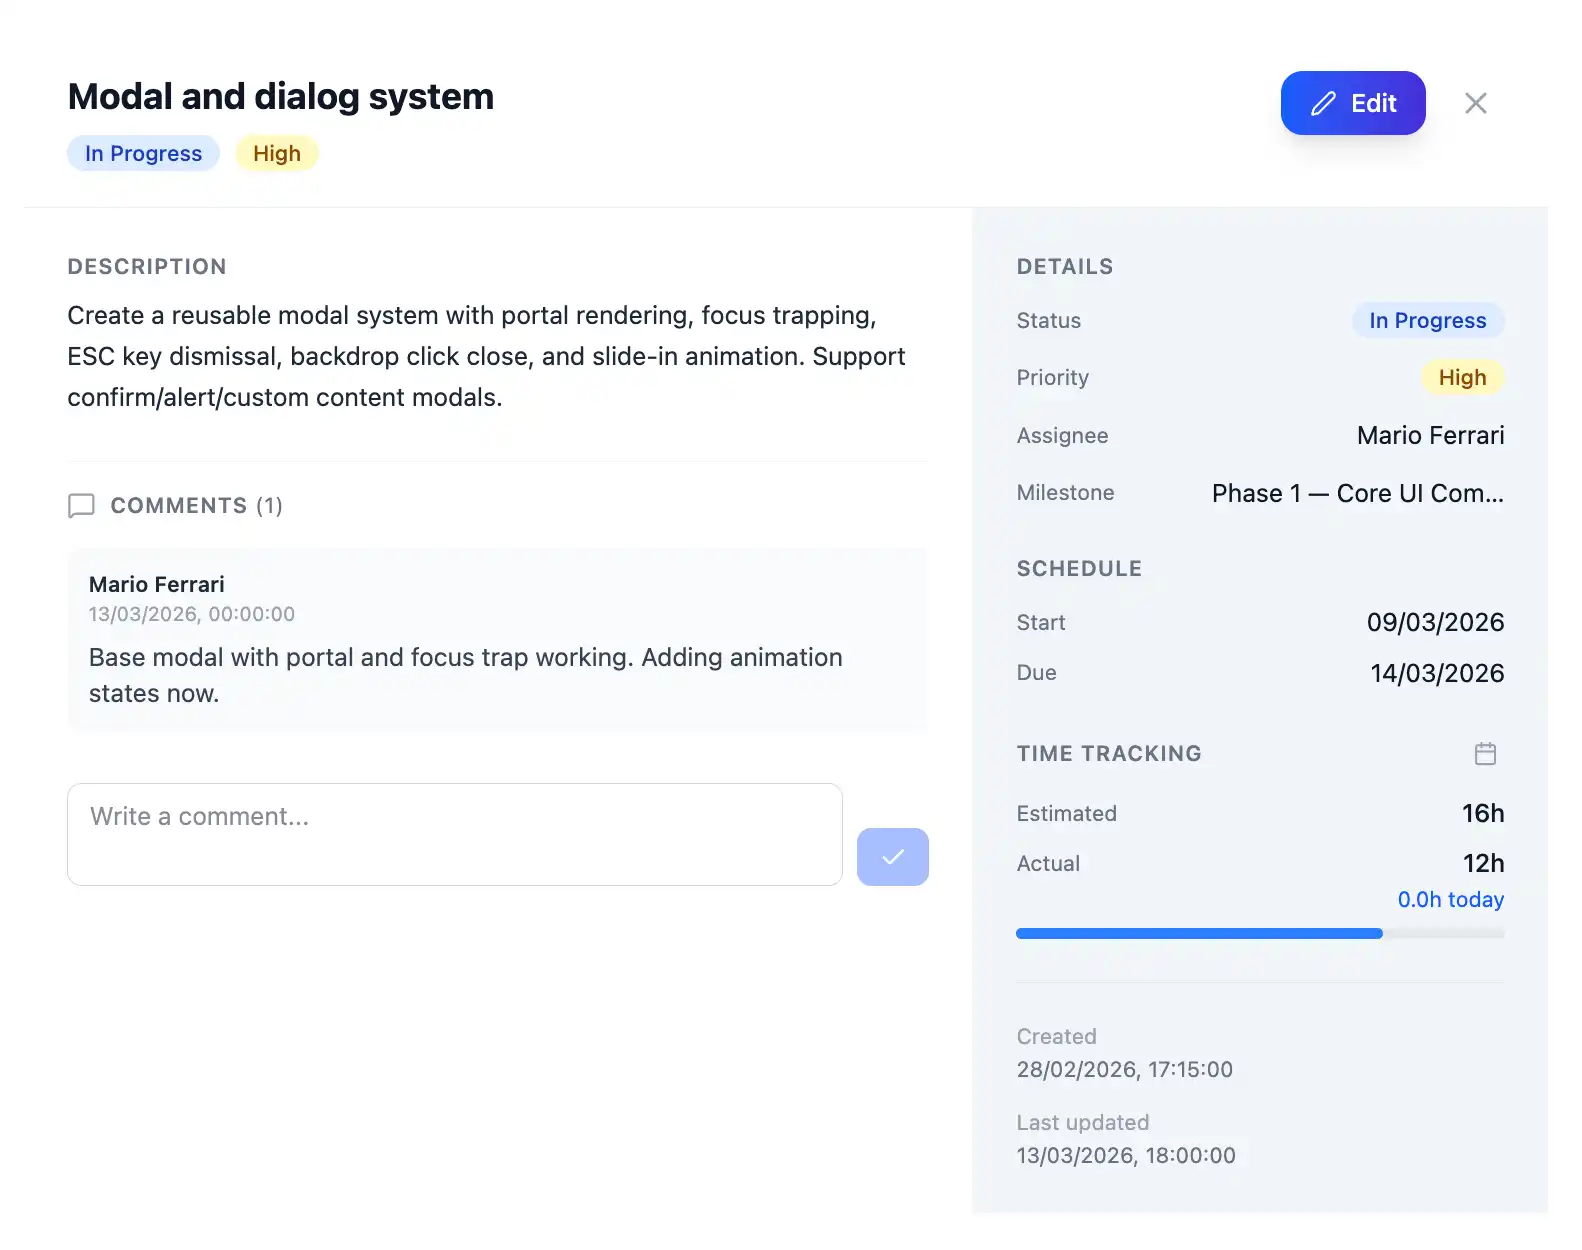
Rich Task Details
Click any task to open everything you need: description, status, time tracking, linked documents, and threaded comments. Edit inline, switch status, and move on.
- Complete task overview in one panel
- Threaded comments for team discussion
- Time logging directly from the task
- Linked documents and dependencies
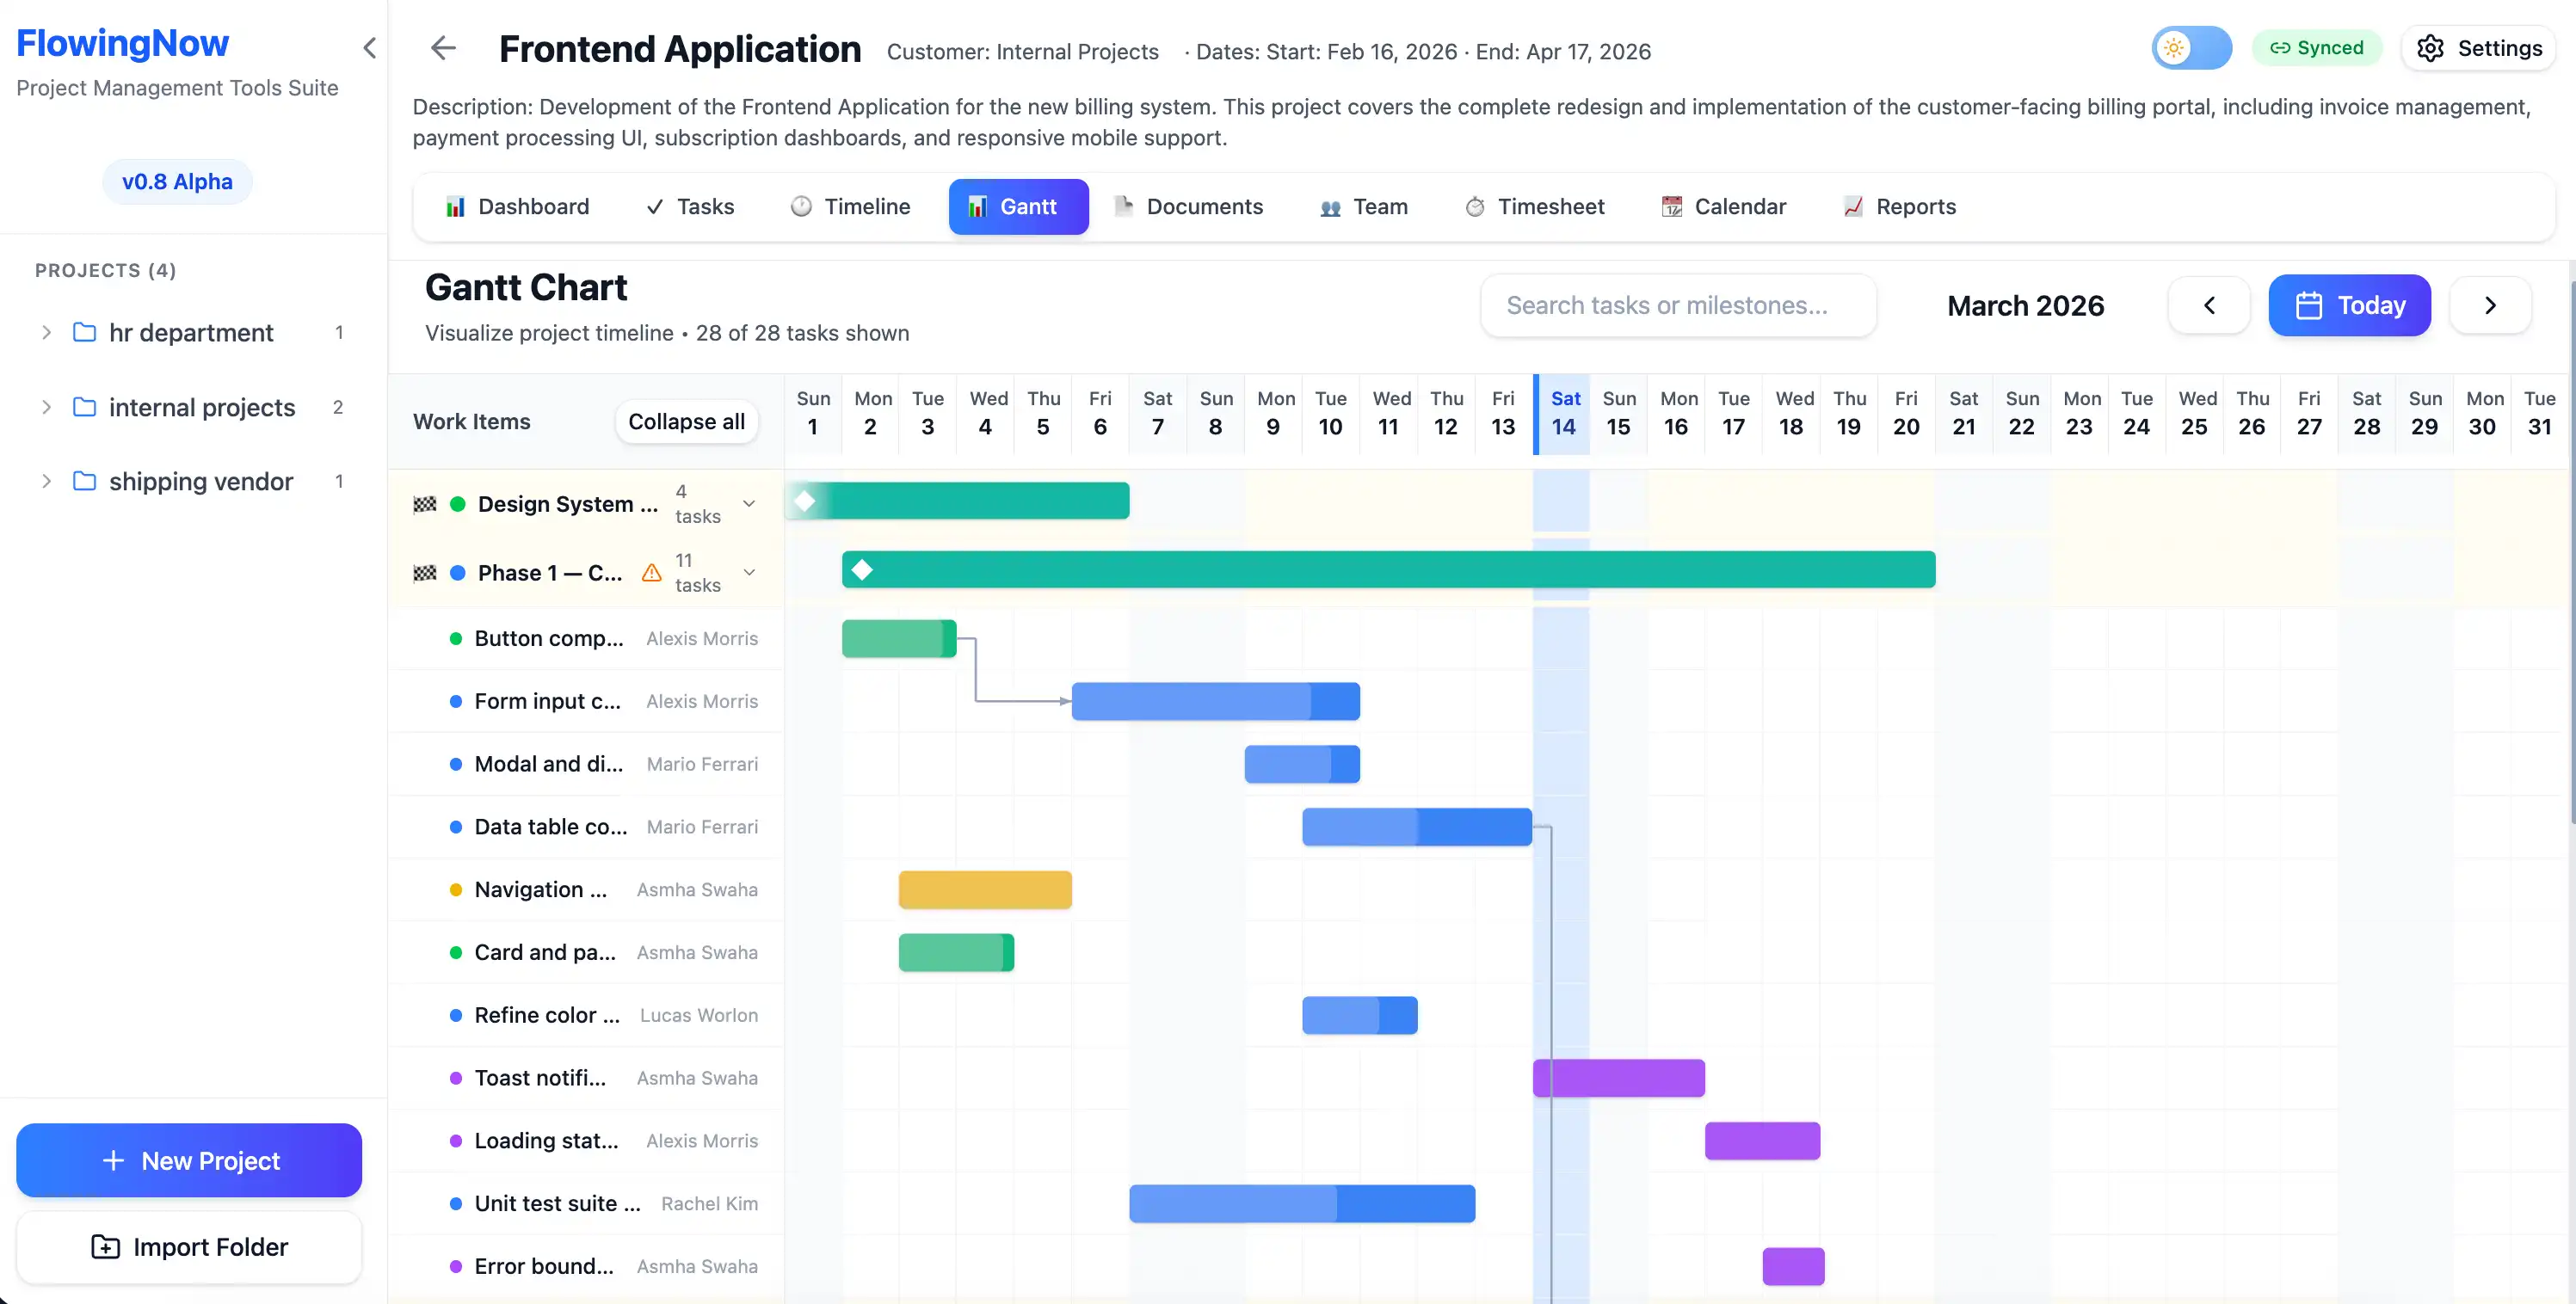
Visual Gantt Charts
See your entire project on a clear visual timeline. Drag, drop, and always know where things stand.
- Interactive month-by-month navigation
- Milestone markers to track key deliverables
- Color-coded task bars grouped by status
- Dependency arrows between tasks
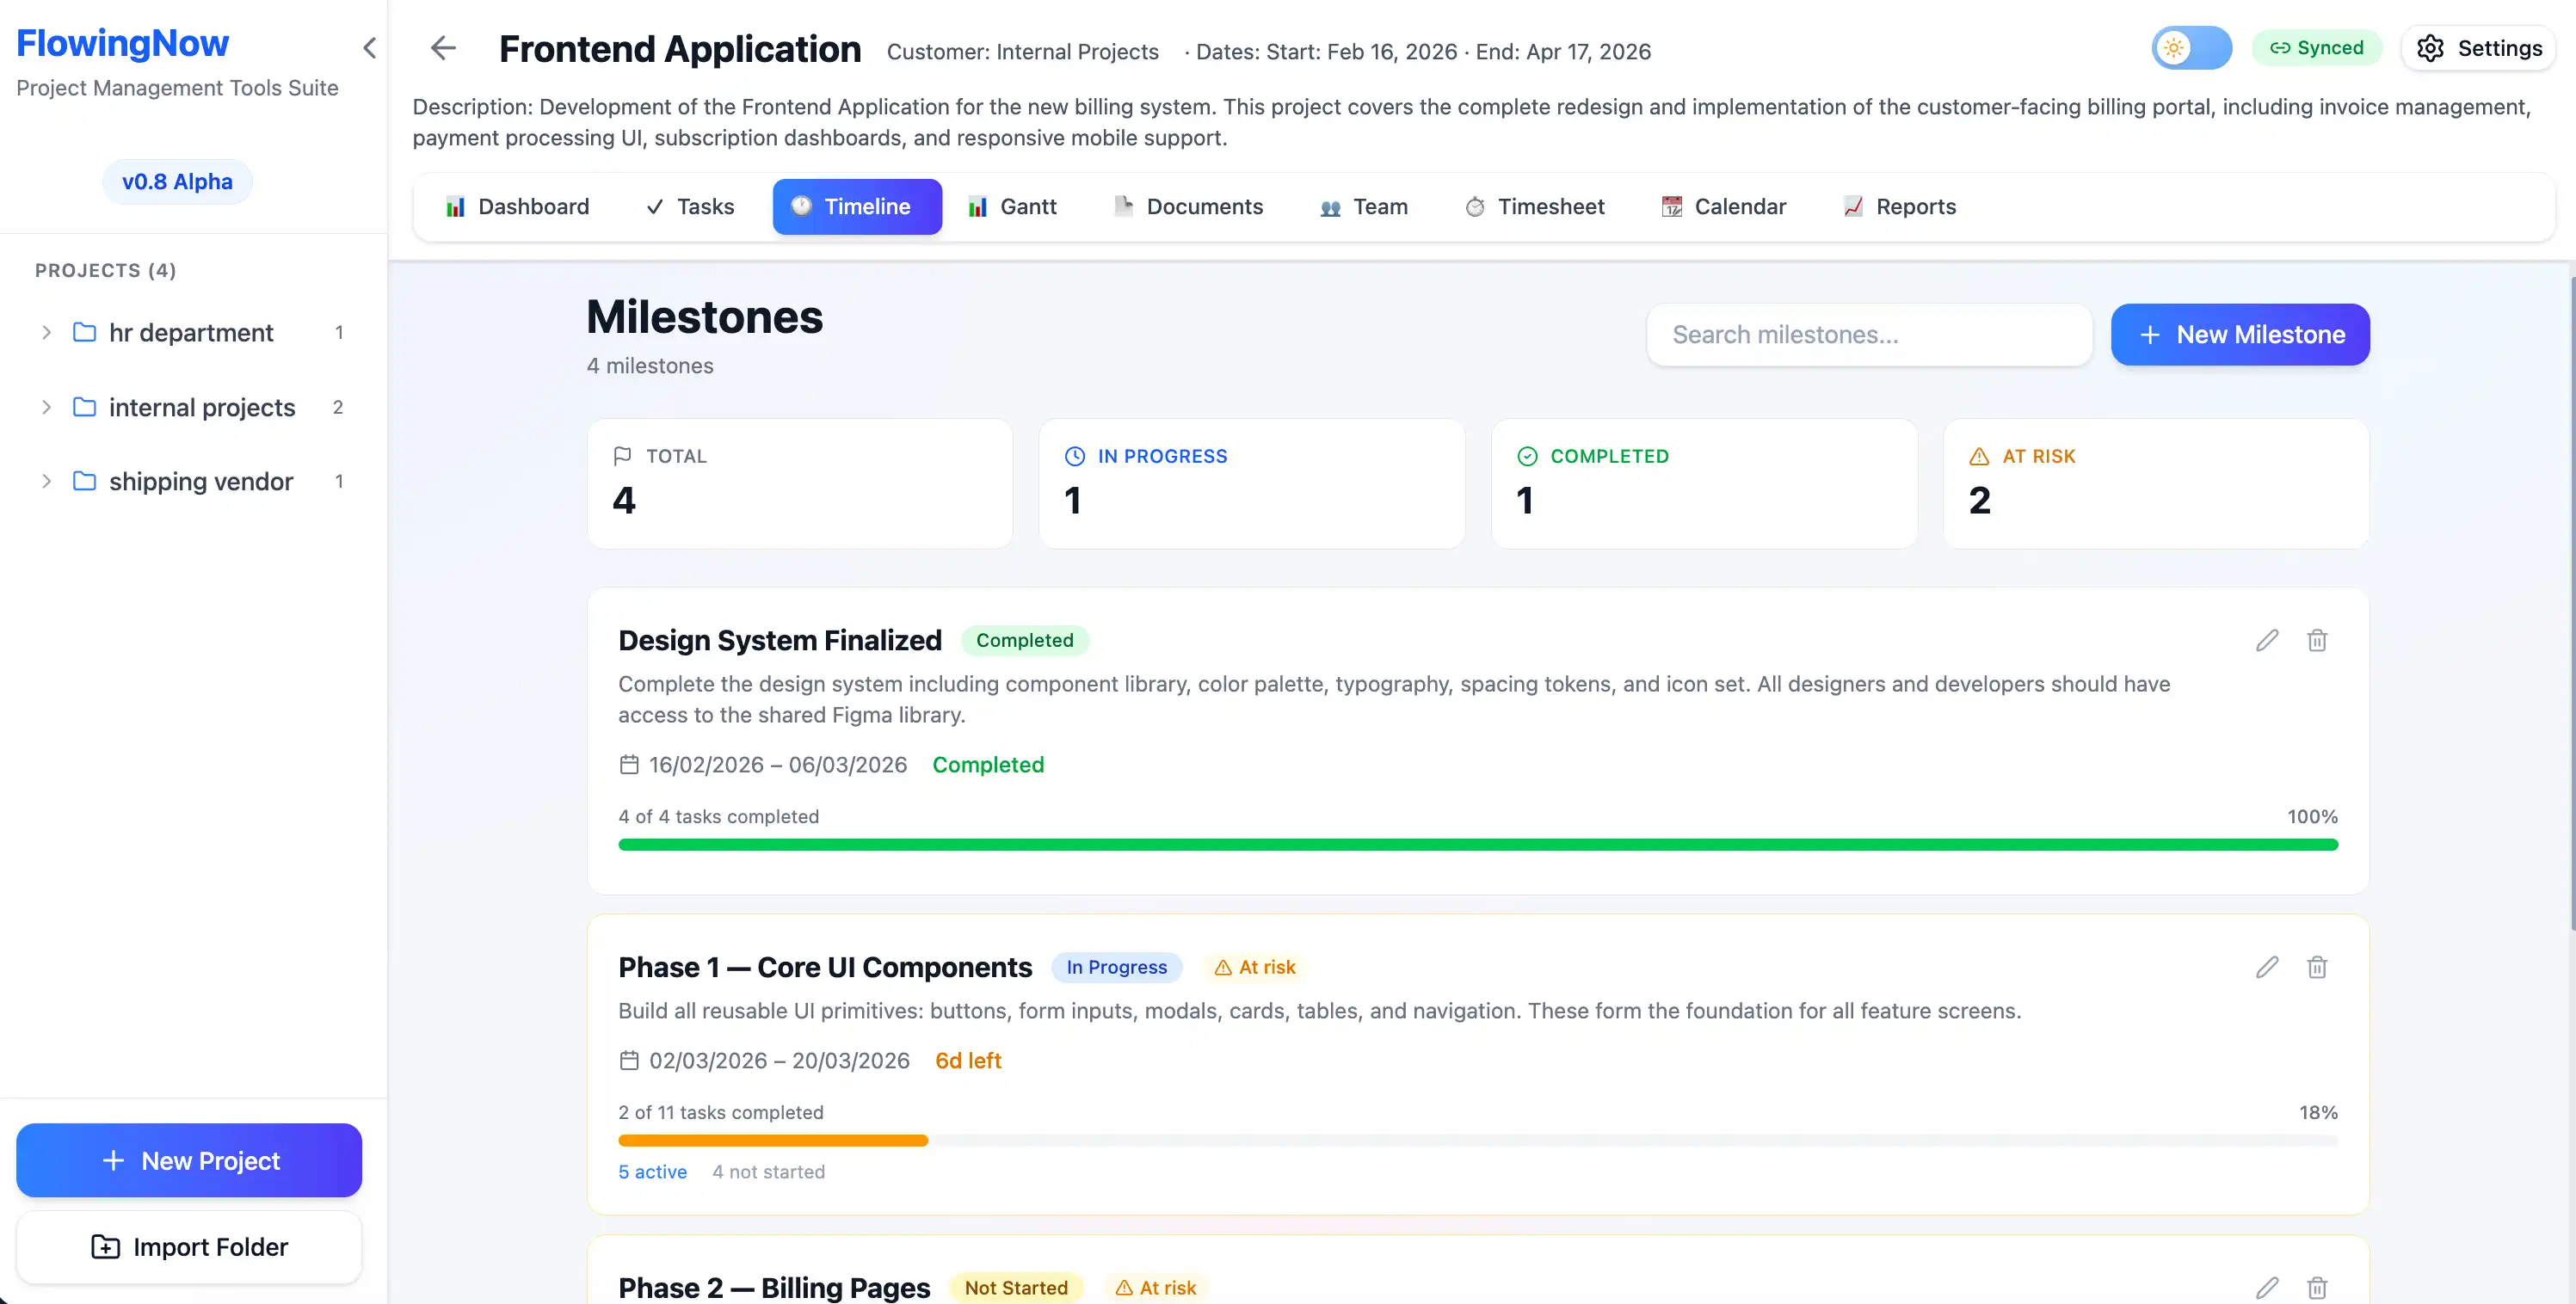
Milestones & Progress
Track major deliverables with visual progress bars. See which milestones are on track, which are slipping, and what's coming up next.
- Visual progress bars for each milestone
- Linked tasks with completion tracking
- Deadline indicators and status labels
- Organized timeline view
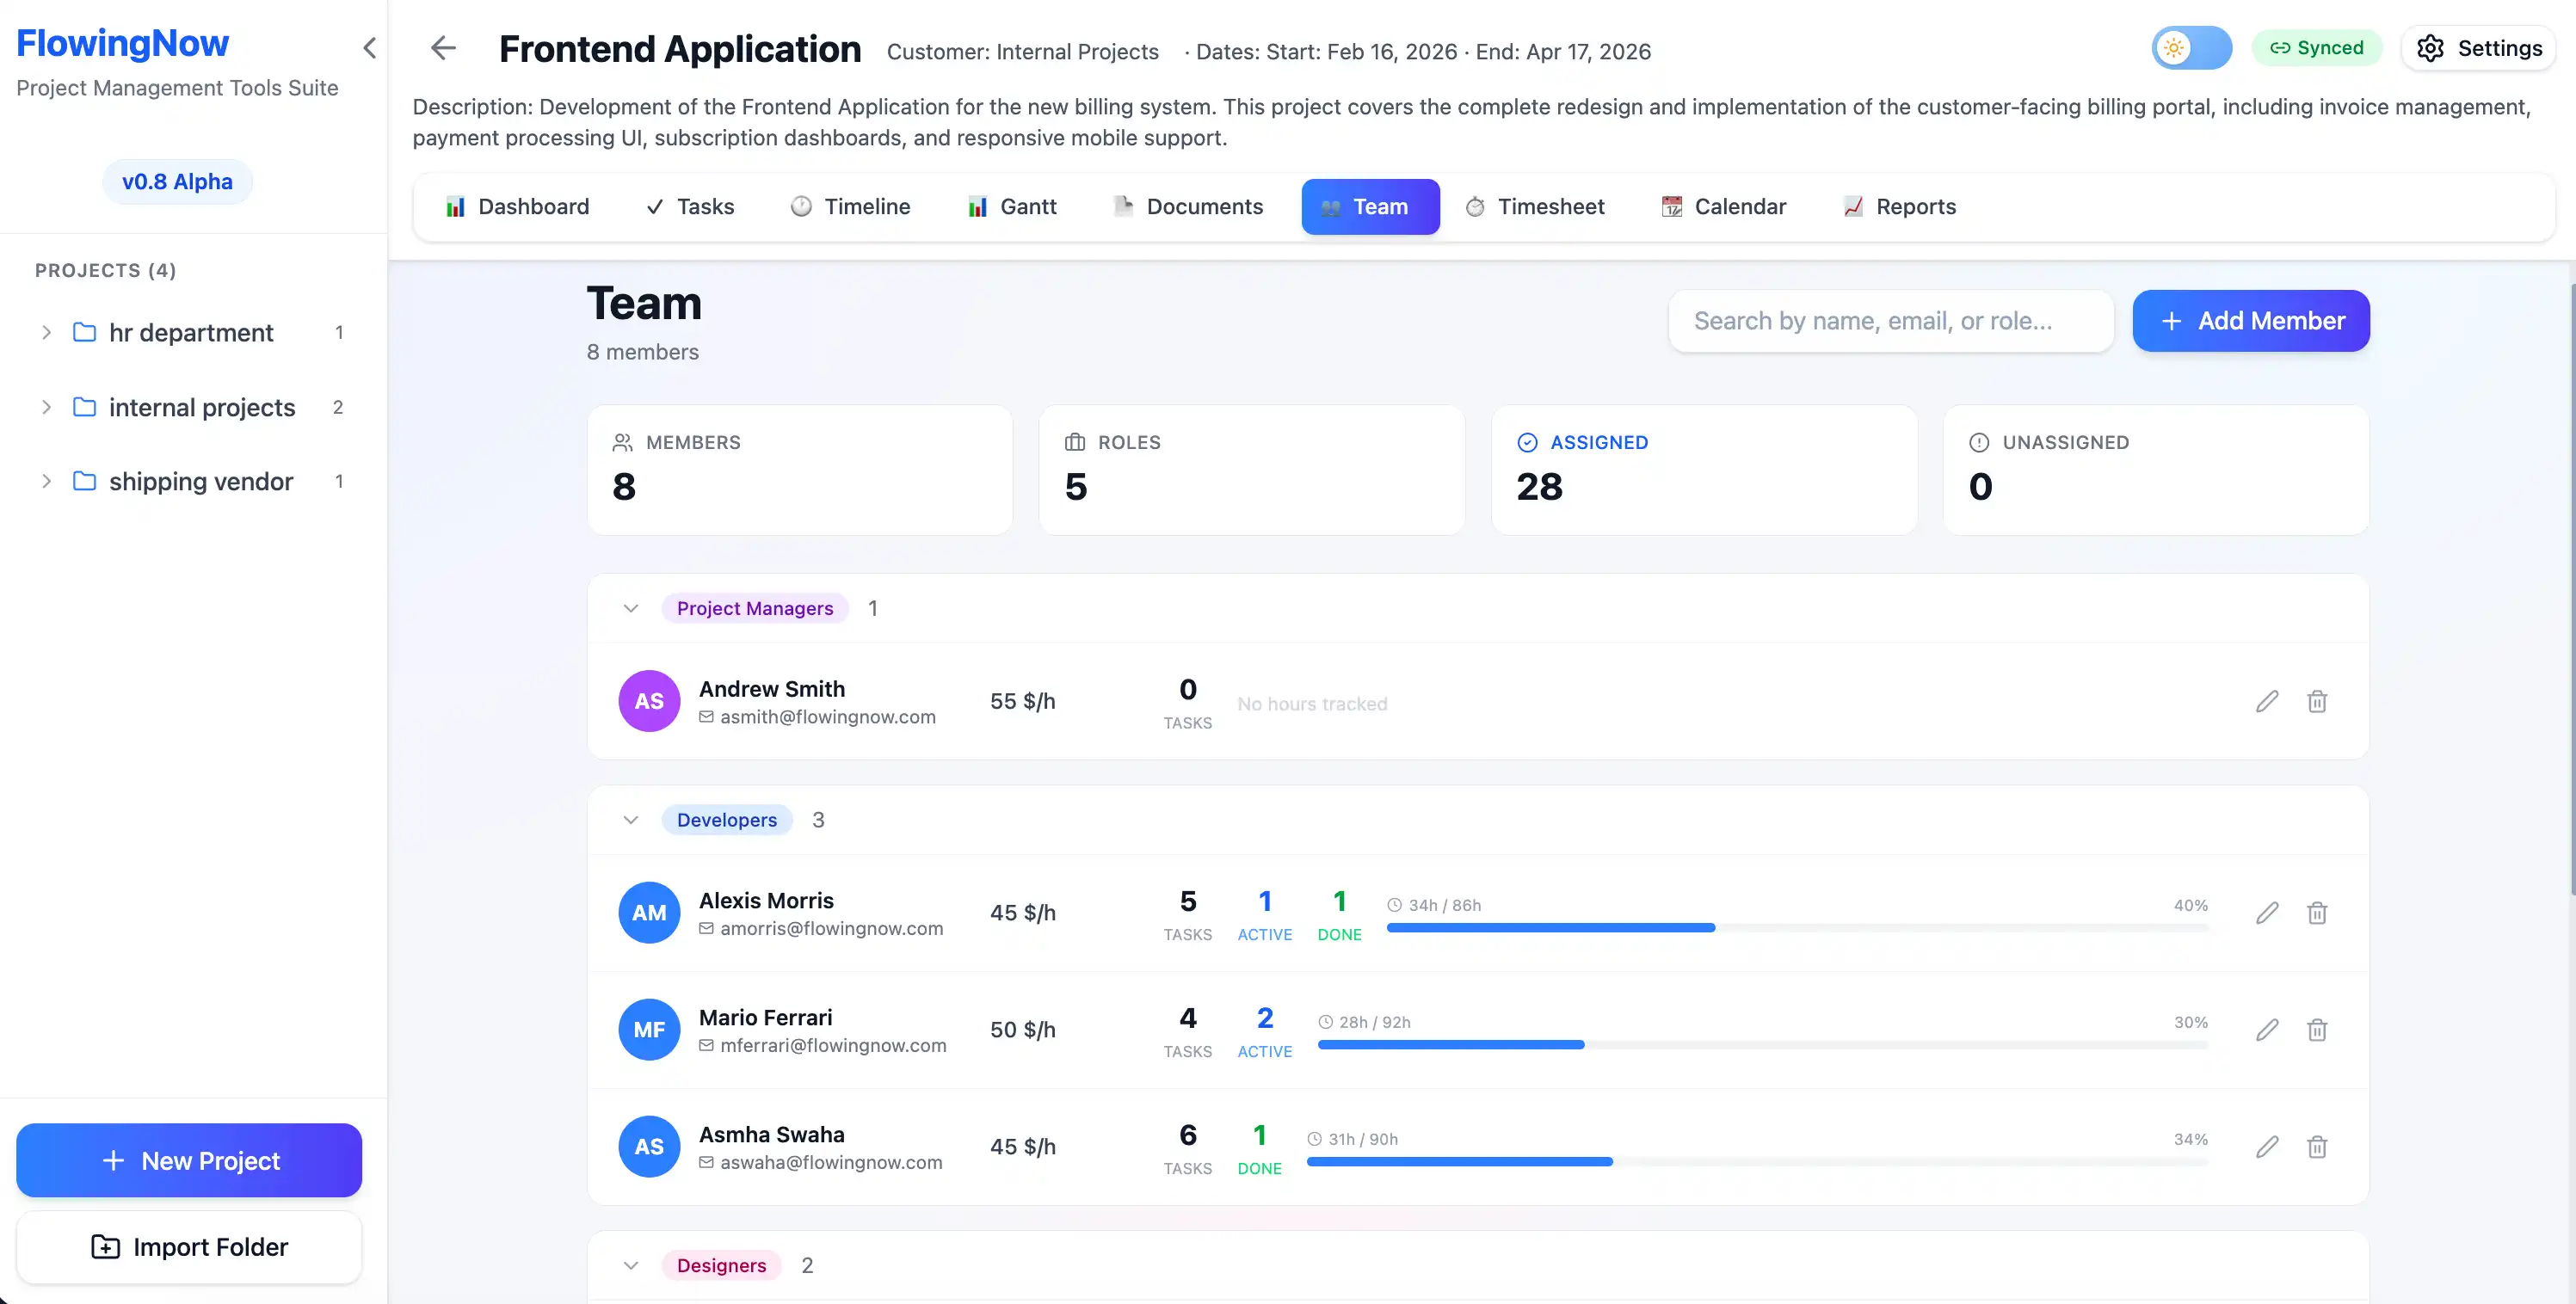
Team Overview
See who's available, who's overloaded, and what everyone is working on. Manage roles, rates, and workload from one clean view.
- Team members grouped by role
- Workload indicators per member
- Task counts and status breakdown
- Hourly rates and cost tracking
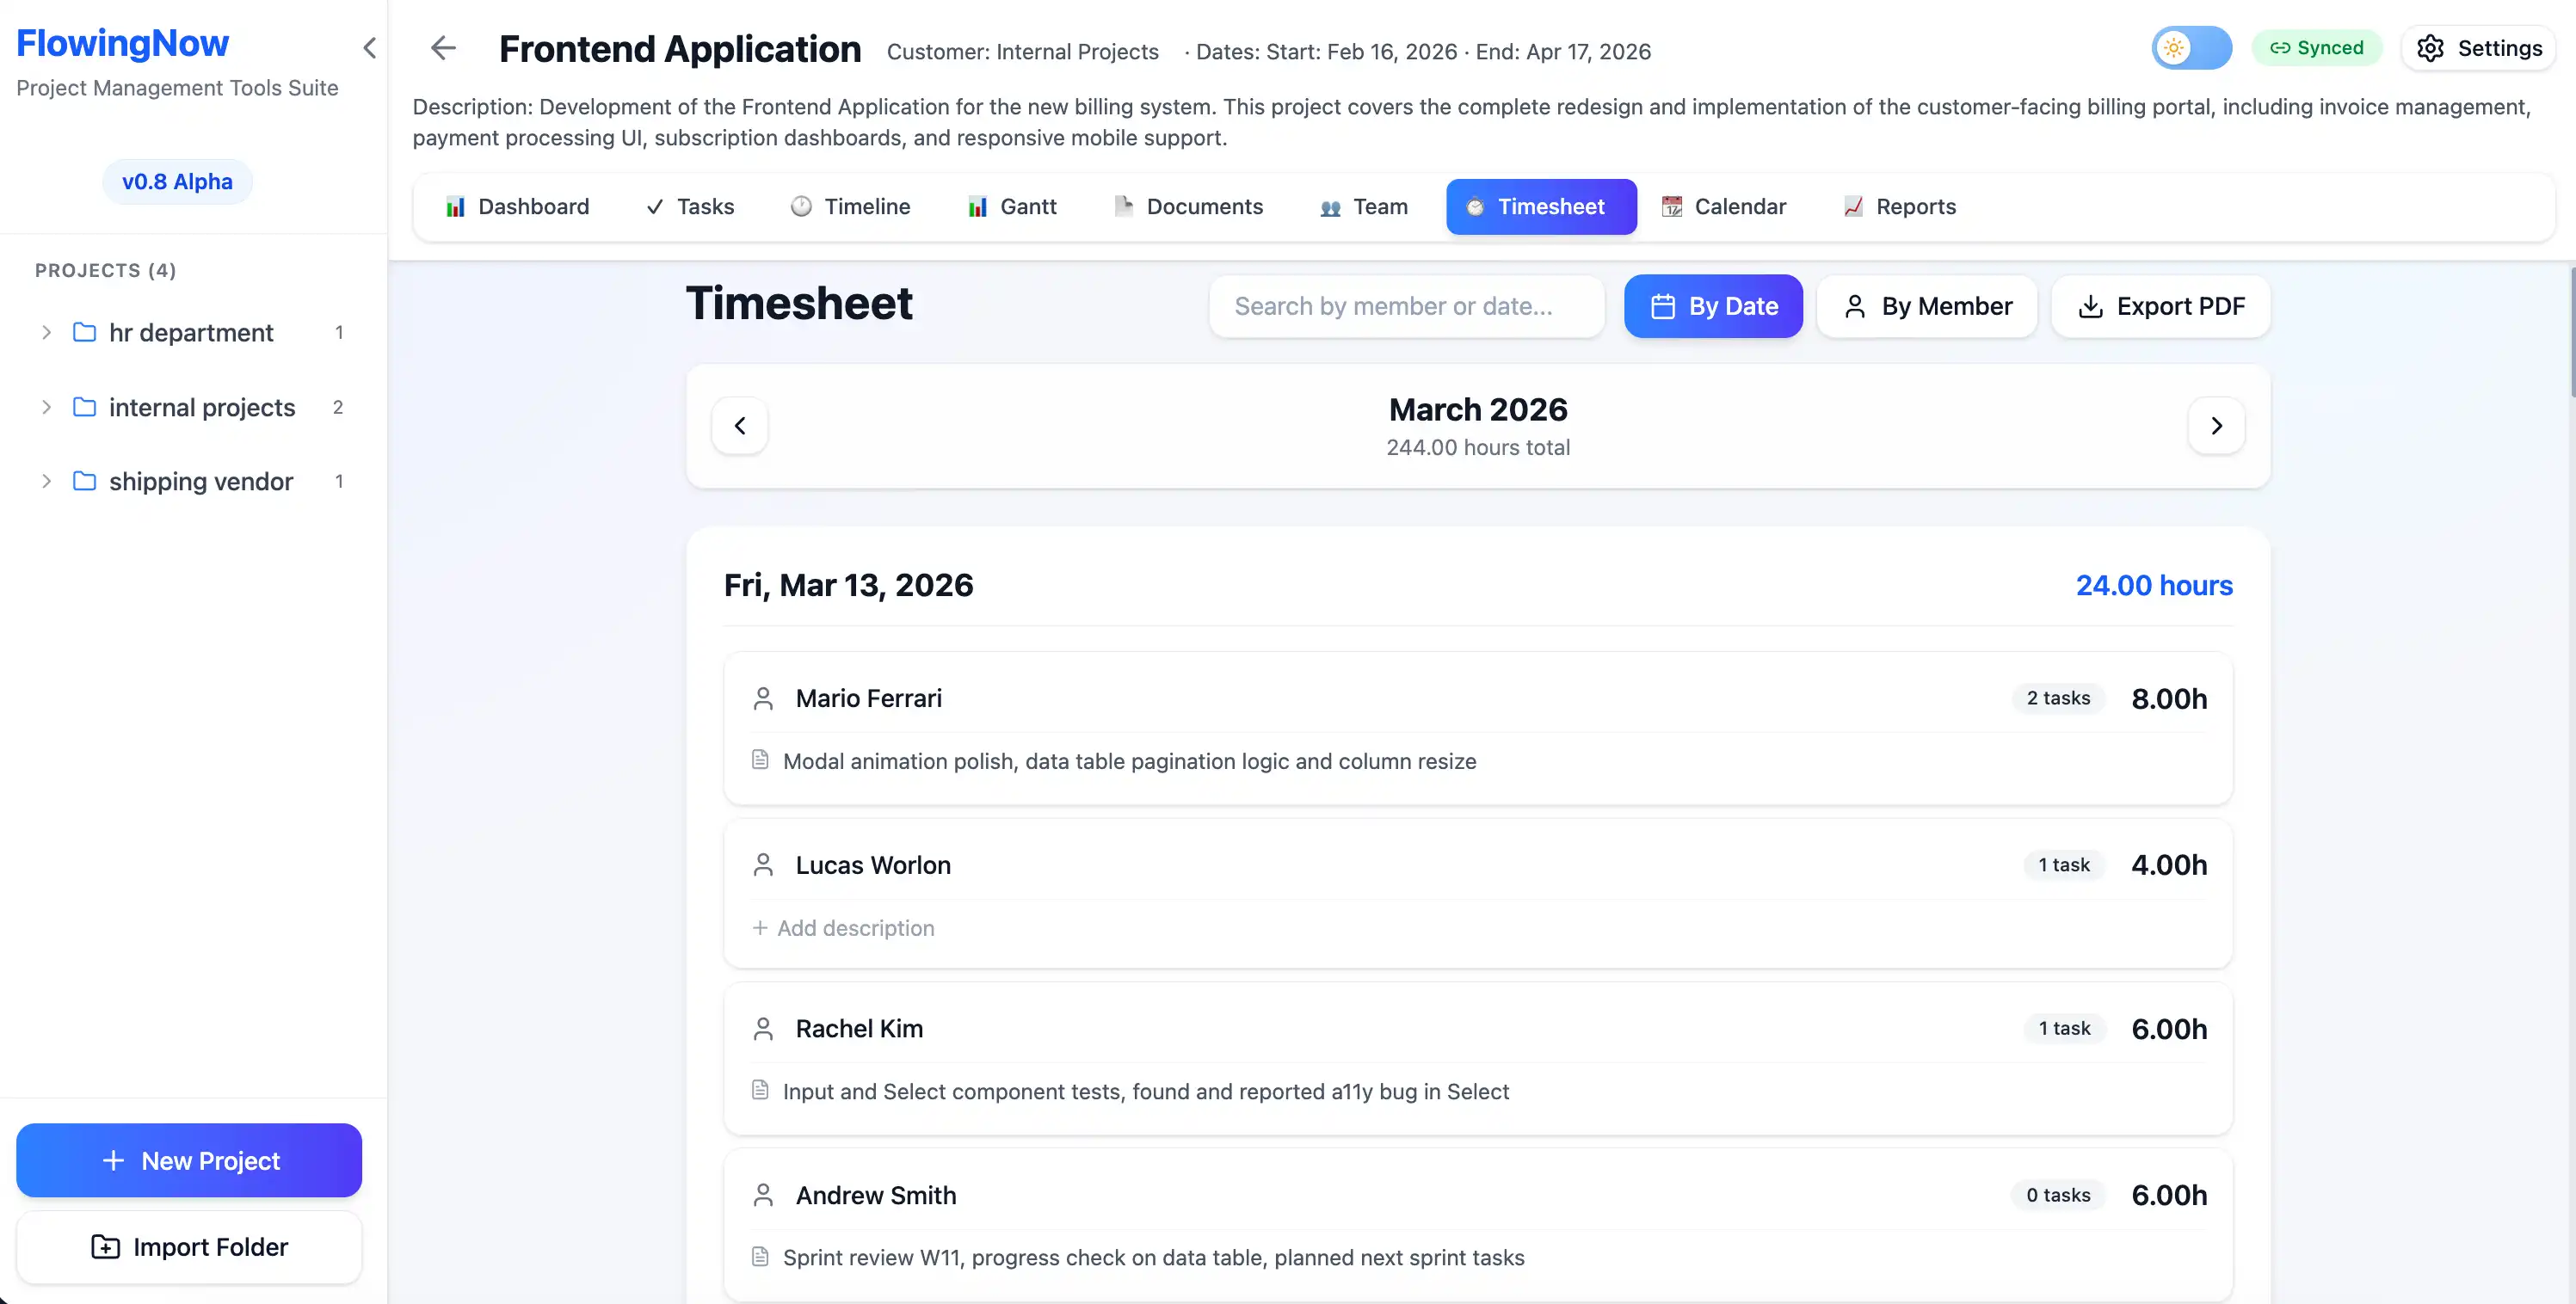
Effortless Time Tracking
Stop chasing your team for hours. Log time in two clicks, review in a clean monthly grid, and export PDF timesheets for invoicing.
- Log hours per task with inline editing
- Monthly timesheet view, ready to review
- Add daily notes for context
- One-click PDF export for invoicing
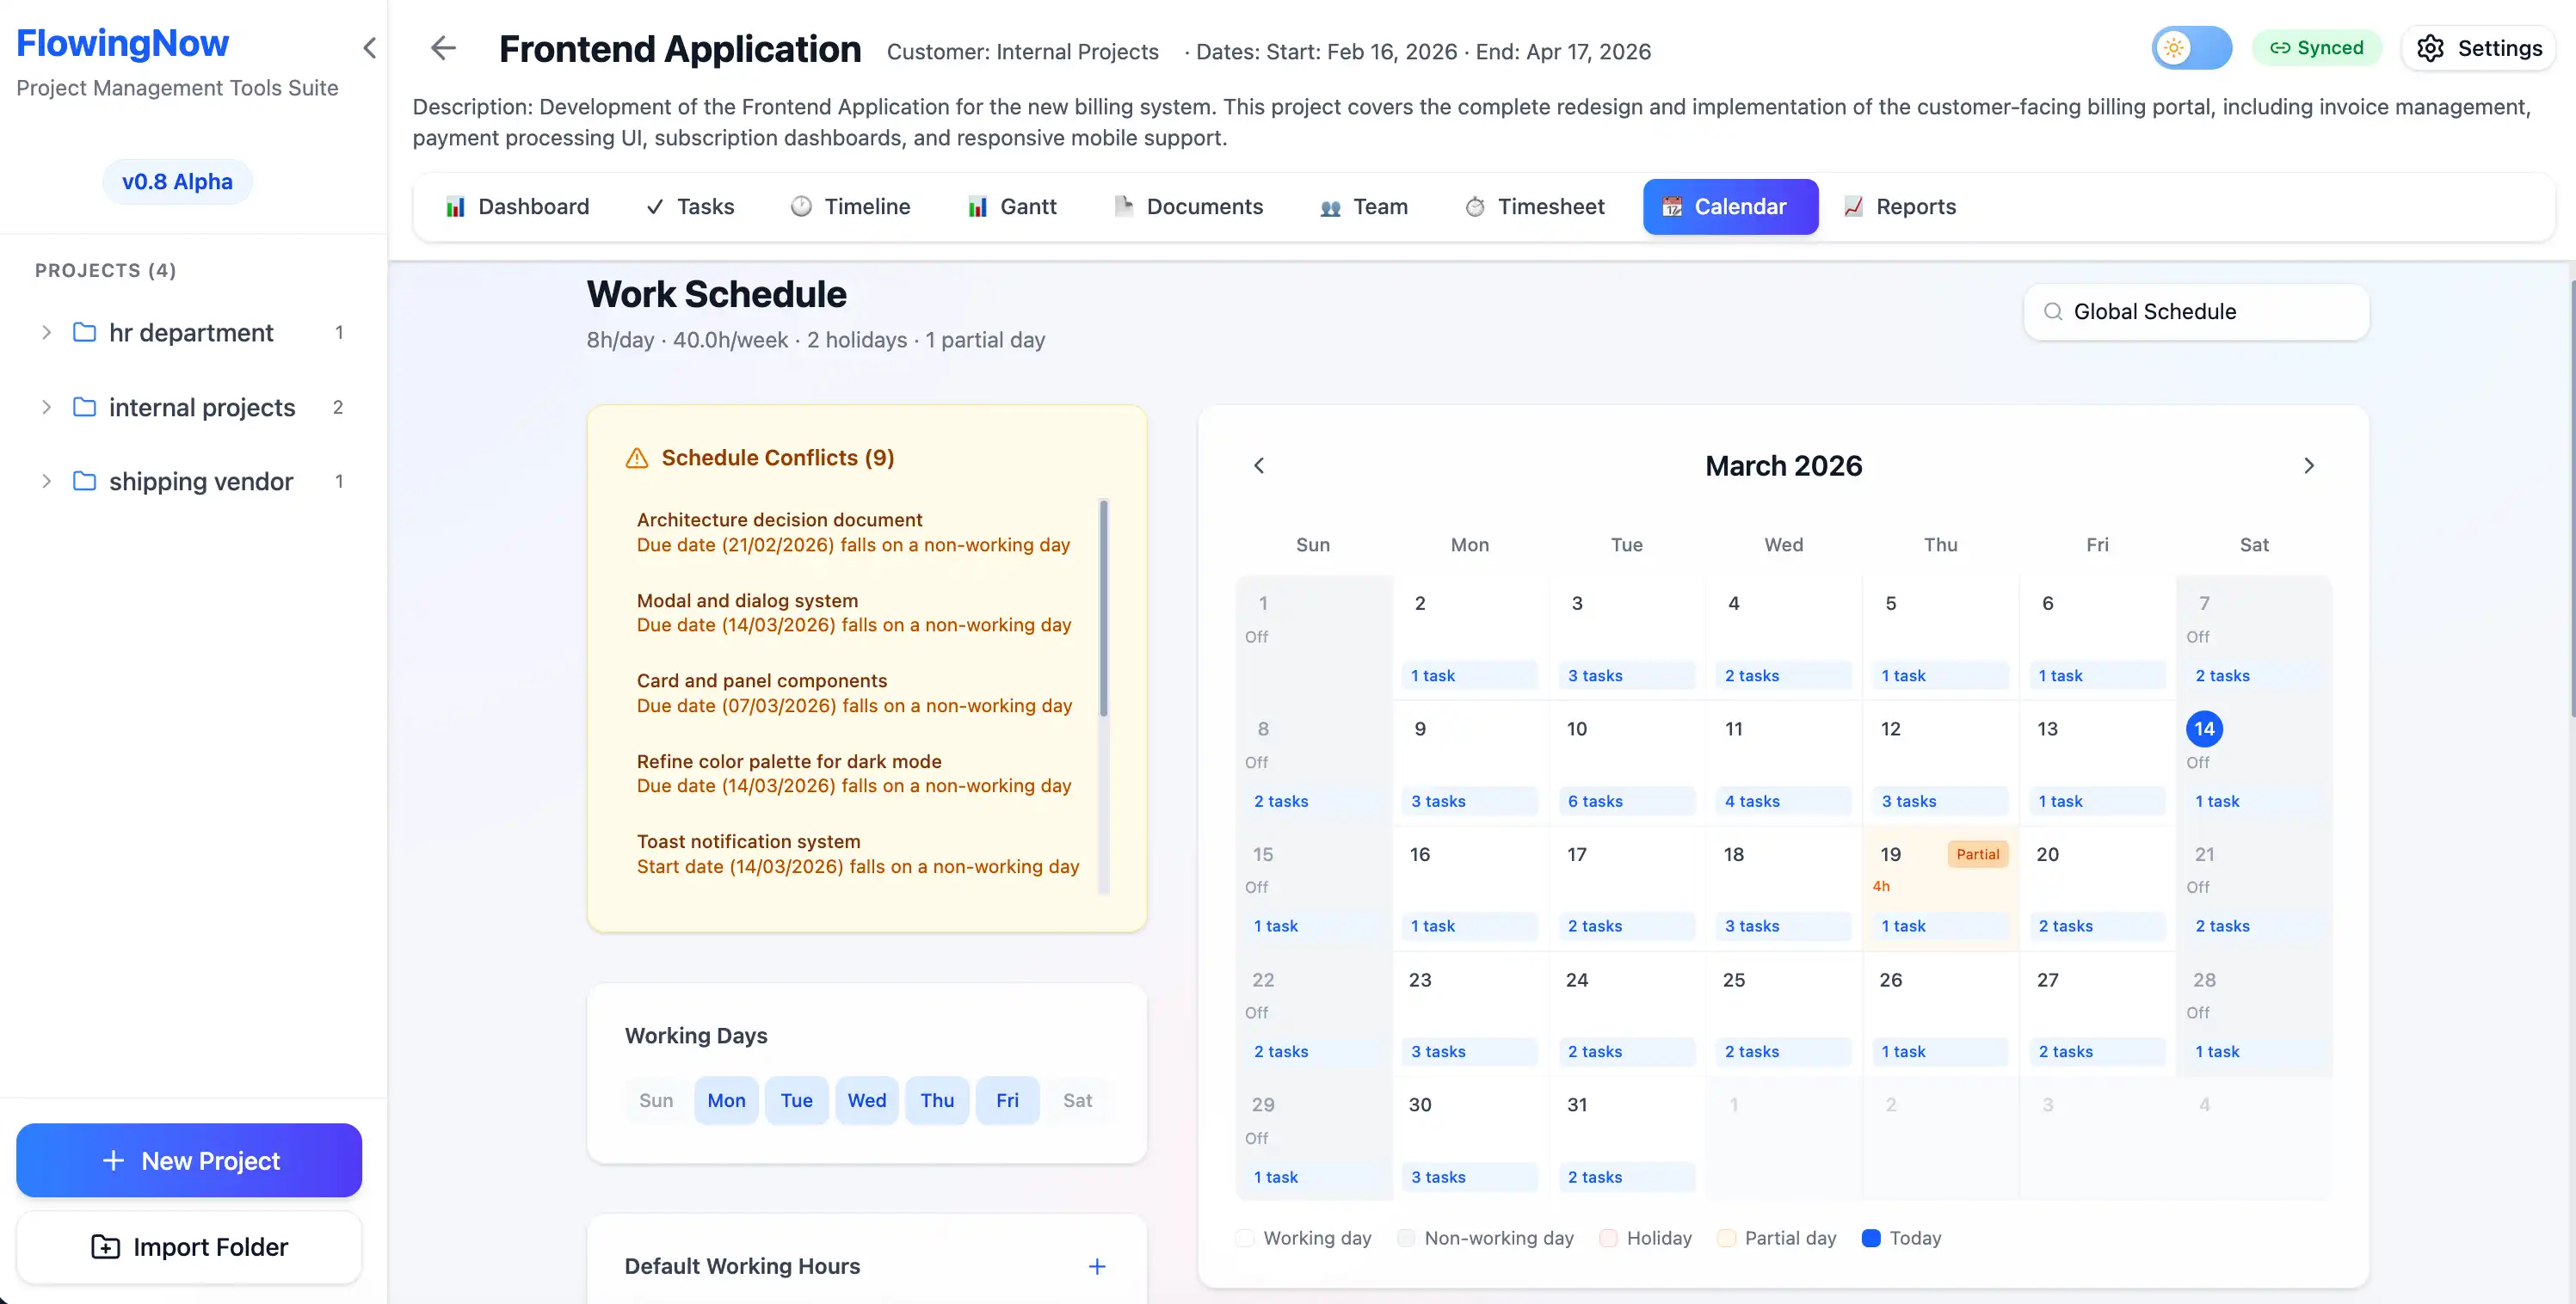
Calendar & Work Schedule
See every deadline and milestone on a clean monthly calendar. Set working hours, holidays, and per-member schedules so FlowingNow plans around real availability.
- Custom work schedules and holiday support
- Per-member schedule overrides
- Schedule conflict detection
- Calendar-aware task scheduling
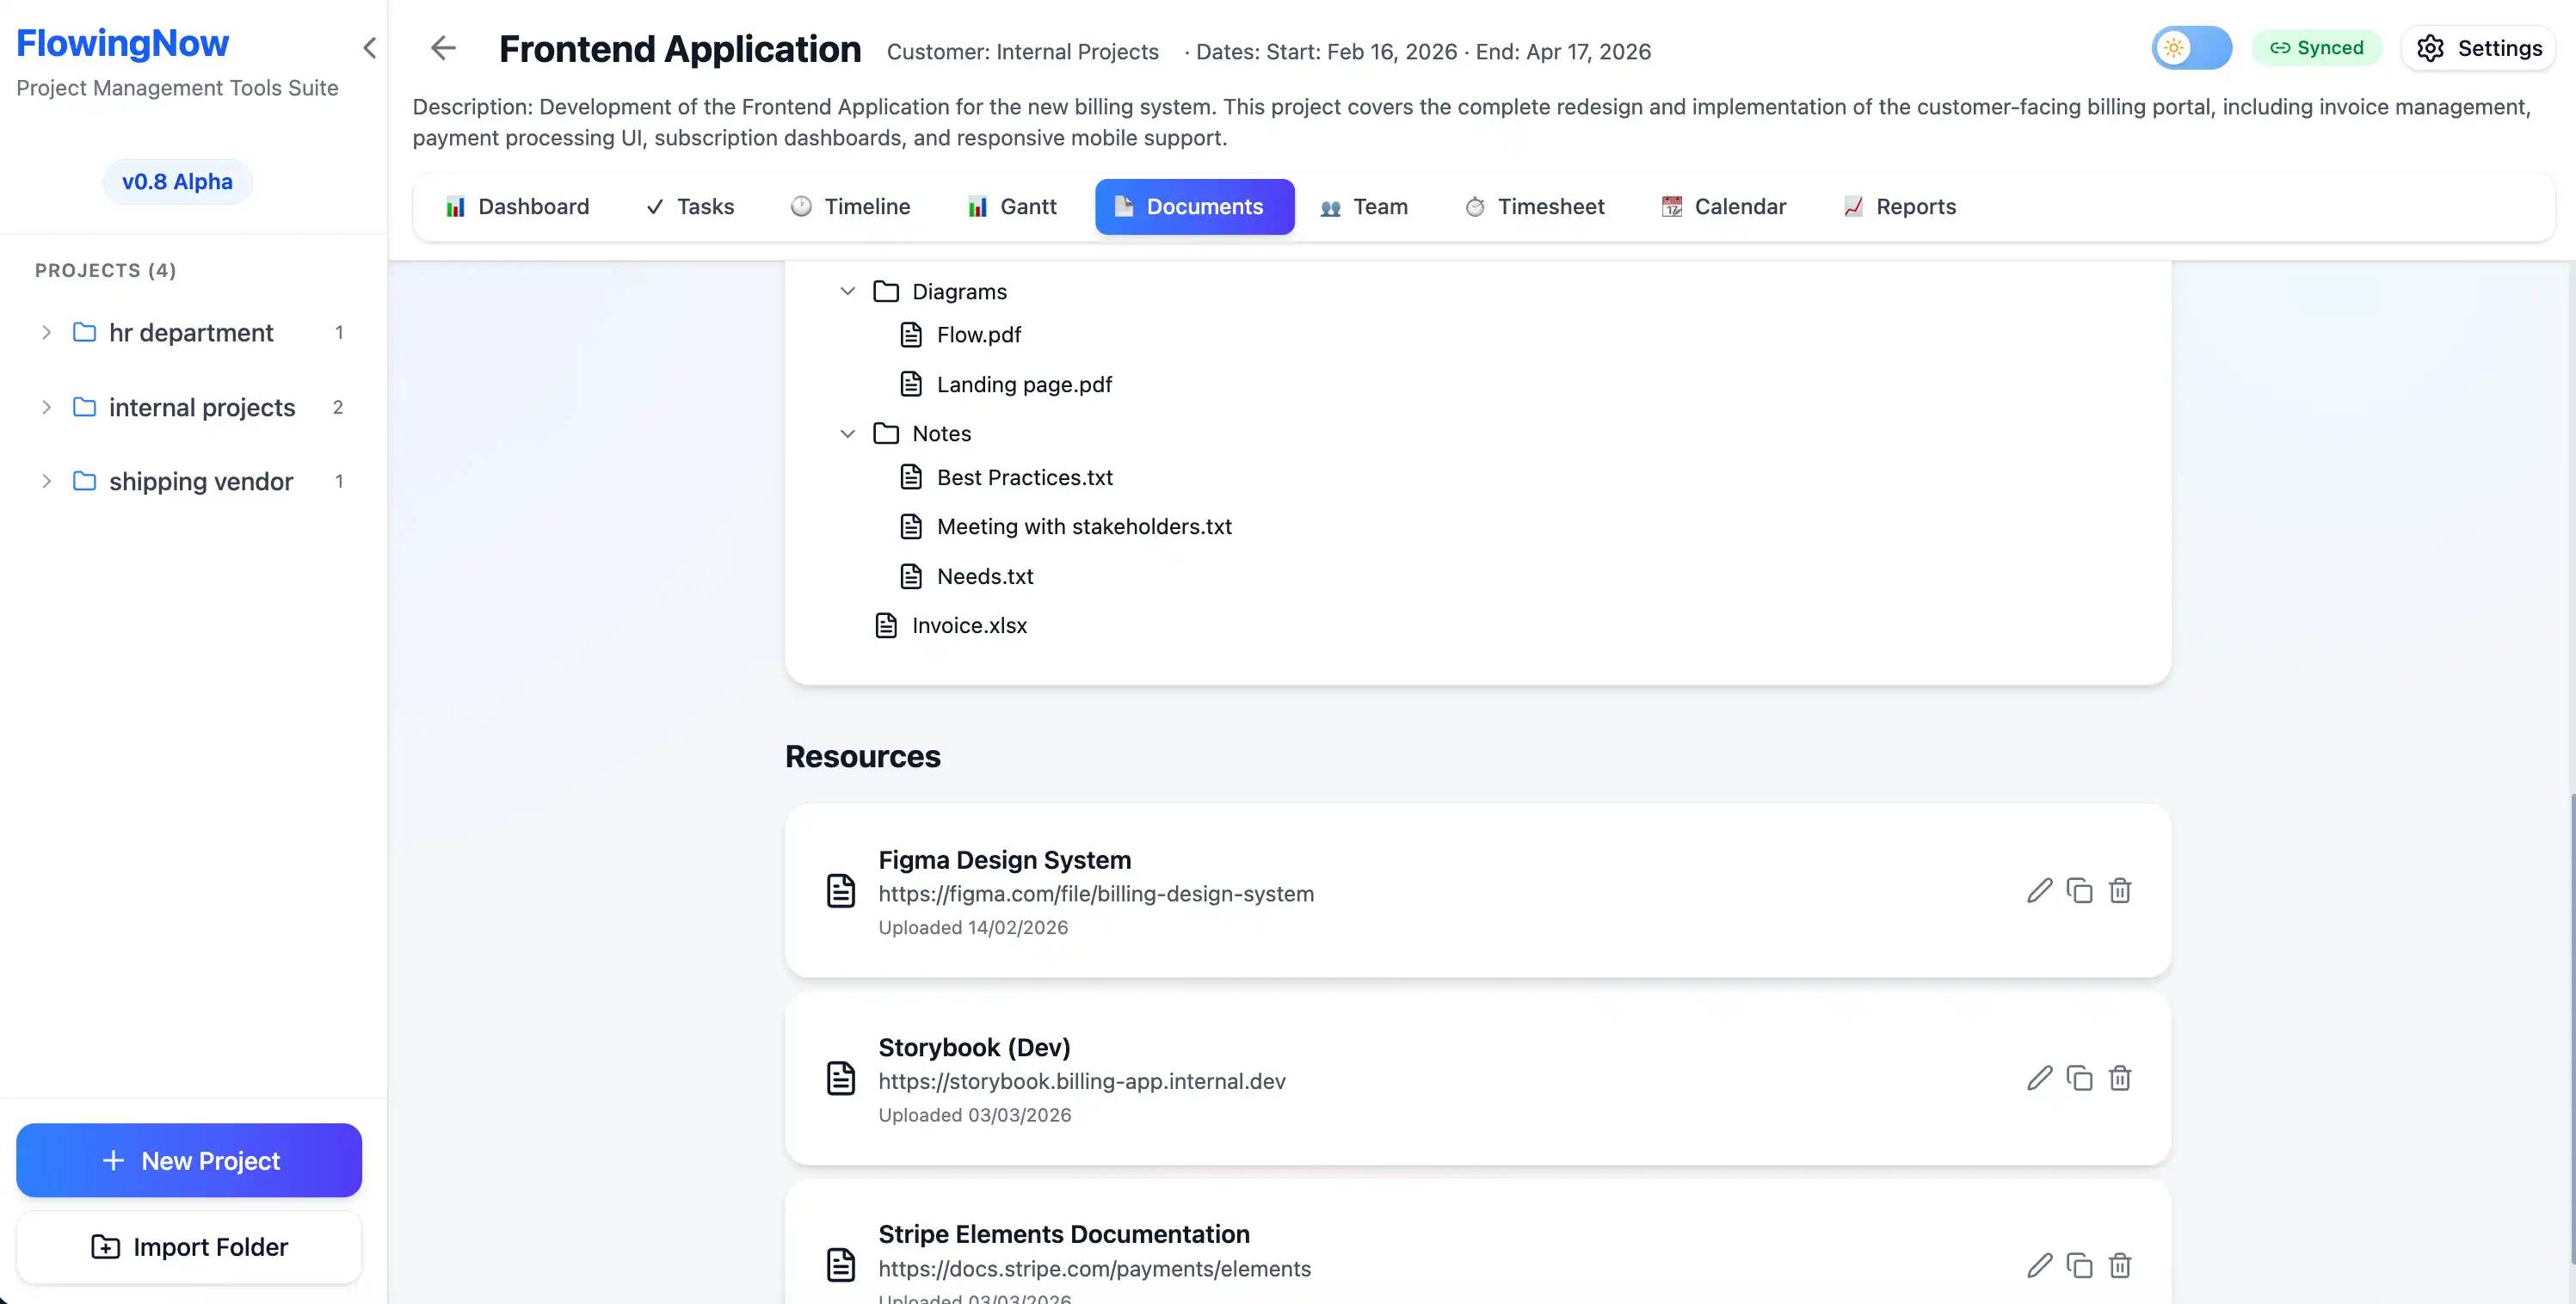
Documents in One Place
Stop digging through email and shared drives. Attach specs, designs, and notes directly to your project. Preview them inline and link them to the tasks that need them.
- Drag-and-drop file upload
- Folder organization with nested files
- Instant preview for images, PDFs, and text
- Link documents to specific tasks
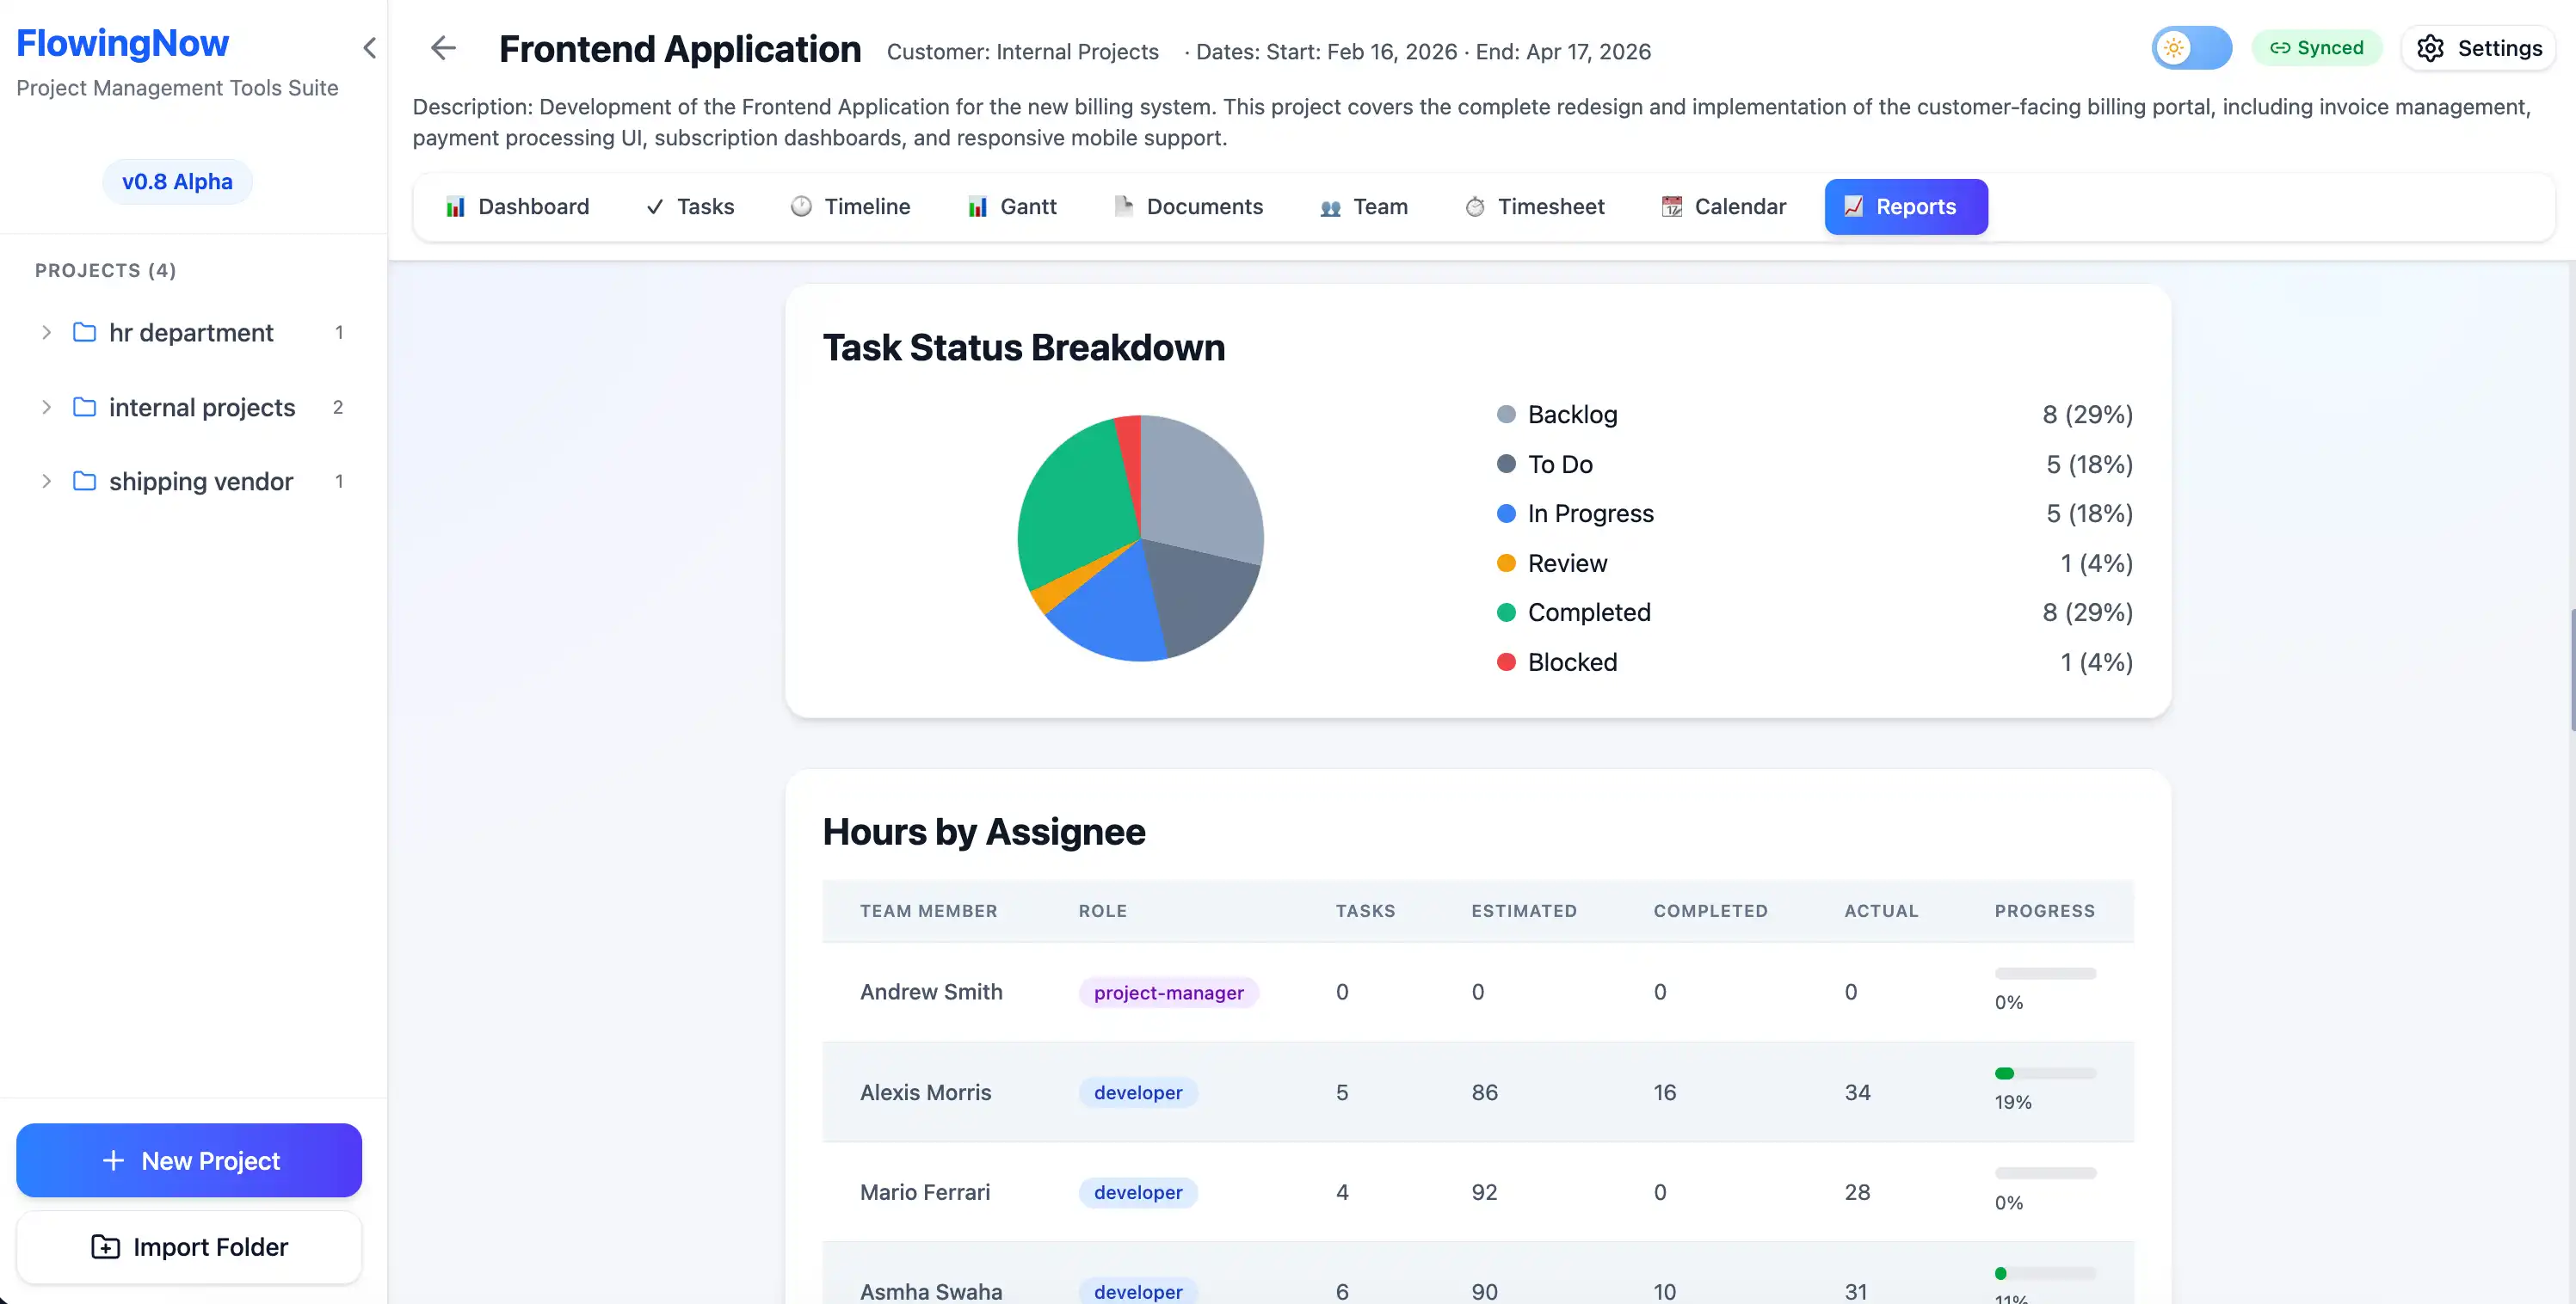
One-Click Reports
Need a status update for stakeholders? One click gives you a professional PDF with progress, budgets, and team performance.
- Task distribution and status breakdown
- Budget health and spending insights
- Team workload and performance overview
- One-click PDF export with selectable sections
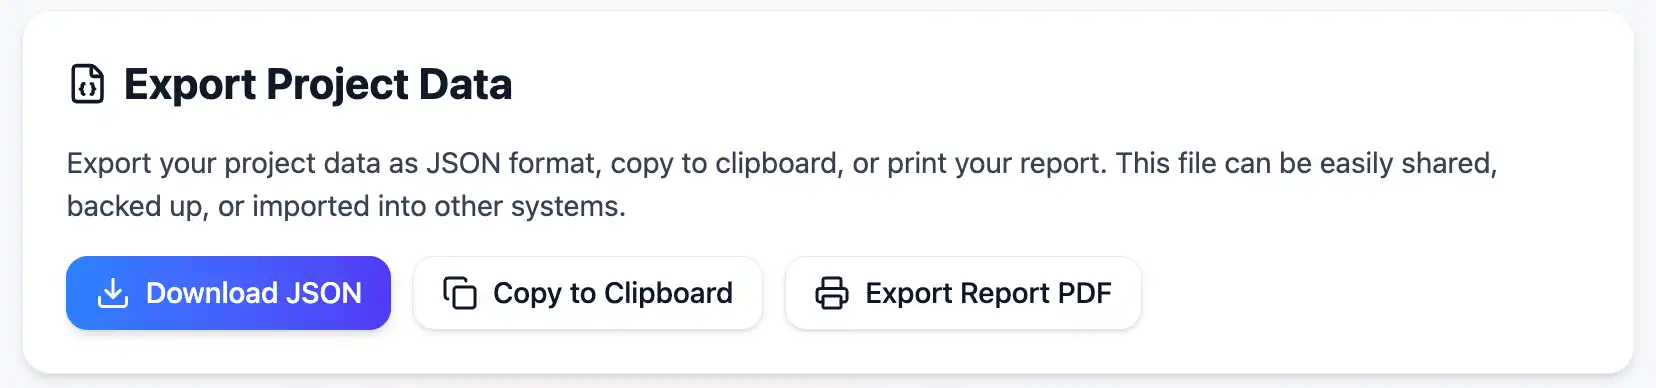
Export & Share
Your data belongs to you. Export complete project data to JSON, generate PDF reports, or share timesheet exports with your team.
- Full project JSON export
- Timesheet PDF with per-member breakdown
- Report PDF with customizable sections
- Import and restore projects
Your Data, Your Device, Your Rules
FlowingNow runs entirely in your browser. No cloud, no server to maintain. Your projects stay on your device, always private and always available.
No setup needed
Works right in your browser. No installs, no IT department needed.
Completely private
Your data never leaves your device. No tracking, no analytics, no third-party access.
Take it anywhere
Export everything to JSON or PDF at any time. Your data belongs to you, always.
Ready to simplify your work?
FlowingNow is free, intuitive, and built for professionals who'd rather deliver projects than learn software.
Try FlowingNow